Columbia College

8620 Westwood Center Drive
Vienna, VA 22182
Top Ranked (2024): View Rankings
previous
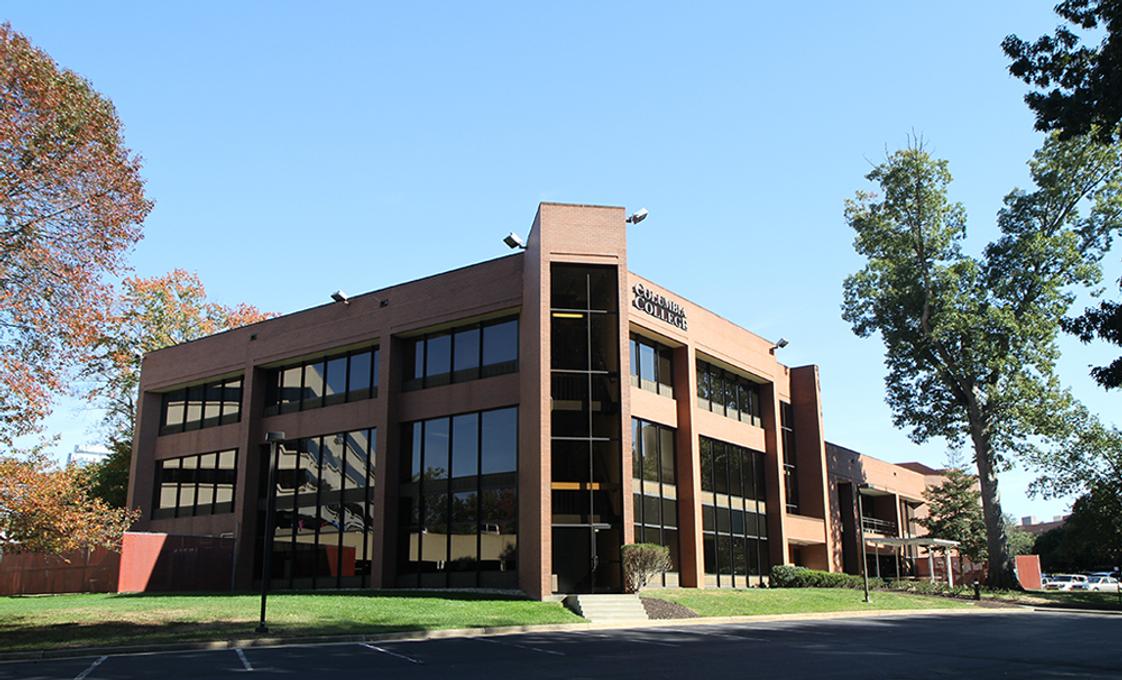
Columbia College Photo #1
next
Columbia College Photo #1
  • Challege to succeed with Columbia College!
  • Columbia College in the Washington D.C. area has three campuses; in Vienna, Centreville, VA, and Silver Spring, MD. The school boasts in strong Vocaational English as a Second Language program. After completing the English Program, students often matriculate at the College for the vocational, practical program such as Cosmetology, Dental Lab Technology, Culinary Arts, Massage Therapy, Business Administration, Computer Science, Technical and Business English, and Teaching English to Early Childhood.

School Highlights

Columbia College serves 371 students (98% of students are full-time).
The college's student:teacher ratio of 10:1 is lower than the state community college average of 17:1.
Minority enrollment is 79% of the student body (majority Asian), which is more than the state average of 48%.

Quick Stats (2024)

  • Enrollment: 371 students
  • Student:teacher ratio: 10:1
  • Minority enrollment: 79%
  • Source: Verified school update

Top Rankings

Columbia College ranks among the top 20% of public schools in Virginia for:

School Overview

The teacher population of 39 teachers has stayed relatively flat over five years.
Columbia College
(VA) Community College Avg.
Carnegie Classification
Not applicable, not in Carnegie universe (not accredited or nondegree-granting)
Associates Colleges
Institution Level
At least 2 but less than 4 years
Institution Control
Private for-profit
Public
Total Faculty
39 staff
129 staff
This chart display total faculty of Columbia College and community college average number of faculty in VA by year, with the latest 2020-21 school year data.
Number of Programs Offered
8
7

Student Body

The student population of Columbia College has stayed relatively flat over five years.
The student:teacher ratio of 10:1 has increased from 9:1 over five years.
The Columbia College diversity score of 0.69 is more than the state average of 0.67. The school's diversity has stayed relatively flat over five years.
Total Enrollment
371 students
2,063 students
This chart display the total enrollment of Columbia College and community college average number of enrollment of VA by year, with the latest 2020-21 school year data.
Student : Teacher Ratio
10:1
17:1
This chart display the student staff ratio of Columbia College and community college average student staff ratio of VA by year, with the latest 2020-21 school year data.
# Full-Time Students
363 students
843 students
This chart display the total number of Full-time students enrollment of Columbia College and average number of community college Full-time students enrollment of VA by year, with the latest 2020-21 school year data.
# Part-Time Students
8 students
1,220 students
This chart display the total number of Part-time students enrollment of Columbia College and average number of community college Part-time students enrollment of VA by year, with the latest 2020-21 school year data.
This chart display the Full-time students and Part-time students enrollment breakdown of Columbia College.
This chart display community college average Full-Time students and Part-Time students enrollment breakdown of VA.
# Enrollment Undergraduate
222 students
232 students
# Full-Time Undergraduate Students
363 students
802 students
This chart display the total number of Full-time undergraduate students enrollment of Columbia College and average number of community college Full-time undergraduate  students enrollment of VA by year, with the latest 2020-21 school year data.
# Full-Time Graduate Students
n/a
101 students
# Part-Time Undergraduate Students
8 students
1,243 students
# Part-Time Graduate Students
n/a
20 students
Total Dormitory Capacity
n/a
476 students
% Asian
49%
7%
This chart display the percentage of Asian students in Columbia College and the percentage of Asian community college students in VA by year, with the latest 2020-21 school year data.
% Hispanic
11%
12%
This chart display the percentage of Hispanic students in Columbia College and the percentage of Hispanic community college students in VA by year, with the latest 2020-21 school year data.
% Black
3%
20%
This chart display the percentage of Black students in Columbia College and the percentage of Black community college students in VA by year, with the latest 2020-21 school year data.
% White
21%
52%
This chart display the percentage of White students in Columbia College and the percentage of White community college students in VA by year, with the latest 2020-21 school year data.
% Two or more races
n/a
4%
% Non Resident races
9%
2%
This chart display the percentage of Non Resident students in Columbia College and the percentage of Non Resident community college students in VA by year, with the latest 2020-21 school year data.
% Unknown races
7%
3%
This chart display the percentage breakdown of students of all ethnic groups in Columbia College.
This chart display the percentage breakdown of students of all ethnic groups in VA.
Diversity Score
0.69
0.67
This chart display the diversity score of Columbia College and the community college average diversity score of VA by year, with the latest 2020-21 school year data.
College Completion Rate (Students who graduate in less than 4 years)
64%
38%
This chart display completion rates for First-Time of Full-time students of Columbia College and community college average completion rates for First-Time of Full-time students of VA by year, with the latest 2020-21 school year data.
College Completion Rate (Students who graduate in 4 years or more than 4 years)
n/a
0.39%

Tuition and Acceptance Rate

% Students Receiving Some Financial Aid
71%
85%
This chart display the percent of students who is receiving some financial aid in Columbia College and the percent of community college students who is receiving some financial aid in VA by year, with the latest 2020-21 school year data.
Median Debt for Graduates
$5,277
$10,500
This chart display median debt for students who have completed a certificate or degree in Columbia College and average median debt for community college students who have completed a certificate or degree in VA by year, with the latest 2020-21 school year data.
Median Debt for Dropouts
n/a
$5,500
Acceptance Rate
n/a
71%
Source: 2021 (or latest year available) Integrated Postsecondary Education Data System (IPEDS)

Frequently Asked Questions

What schools are Columbia College often compared to?
Columbia Collegeis often viewed alongside schools like Northern Virginia Community College by visitors of our site.
What is Columbia College's ranking?
Columbia College ranks among the top 20% of community college in Virginia for: Diversity in US community colleges, Highest completion rates and Least debt for graduating students.

Recent Articles

Microcredentials: Tailoring Learning Journeys in Robotics
Micro-credentials offer a unique opportunity for adult learners to tailor their learning journeys to their specific needs and career aspirations. In this article we explore micro-credentials in robotics.
6 New Features for Community College Students
Check out the new features waiting for community college students heading back to school, from new security procedures, to campus housing, classes and degree programs.
Managing Student Loan Debt: How to Budget for Affordability
Struggling with student loan debt? Learn expert strategies on how to effectively manage and budget for affordability. Discover practical tips and insightful advice to take control of your finances and pave the way to financial freedom

Quick Stats (2024)

  • Enrollment: 371 students
  • Student:teacher ratio: 10:1
  • Minority enrollment: 79%
  • Source: Verified school update

Related School Videos

Did You Know?

For Virginia public community colleges, the average tuition is approximately $3,748 per year for in-state students and $8,977 for out-of-state students. For private community colleges, the average yearly tuition is approximately $15,590 per year. Read more about average community college tuition costs across the country.

The average community college acceptance rate in Virginia is 72%. Read more about national community college acceptance rates.

Virginia community colleges have a diversity score of 0.67, which is lower than the national average of 0.70. The most diverse community college in Virginia is Northern Virginia Community College. Read more about community college diversity statistics in the USA.

Quick Links